Energy Management Systems: A Complete Guide
In short
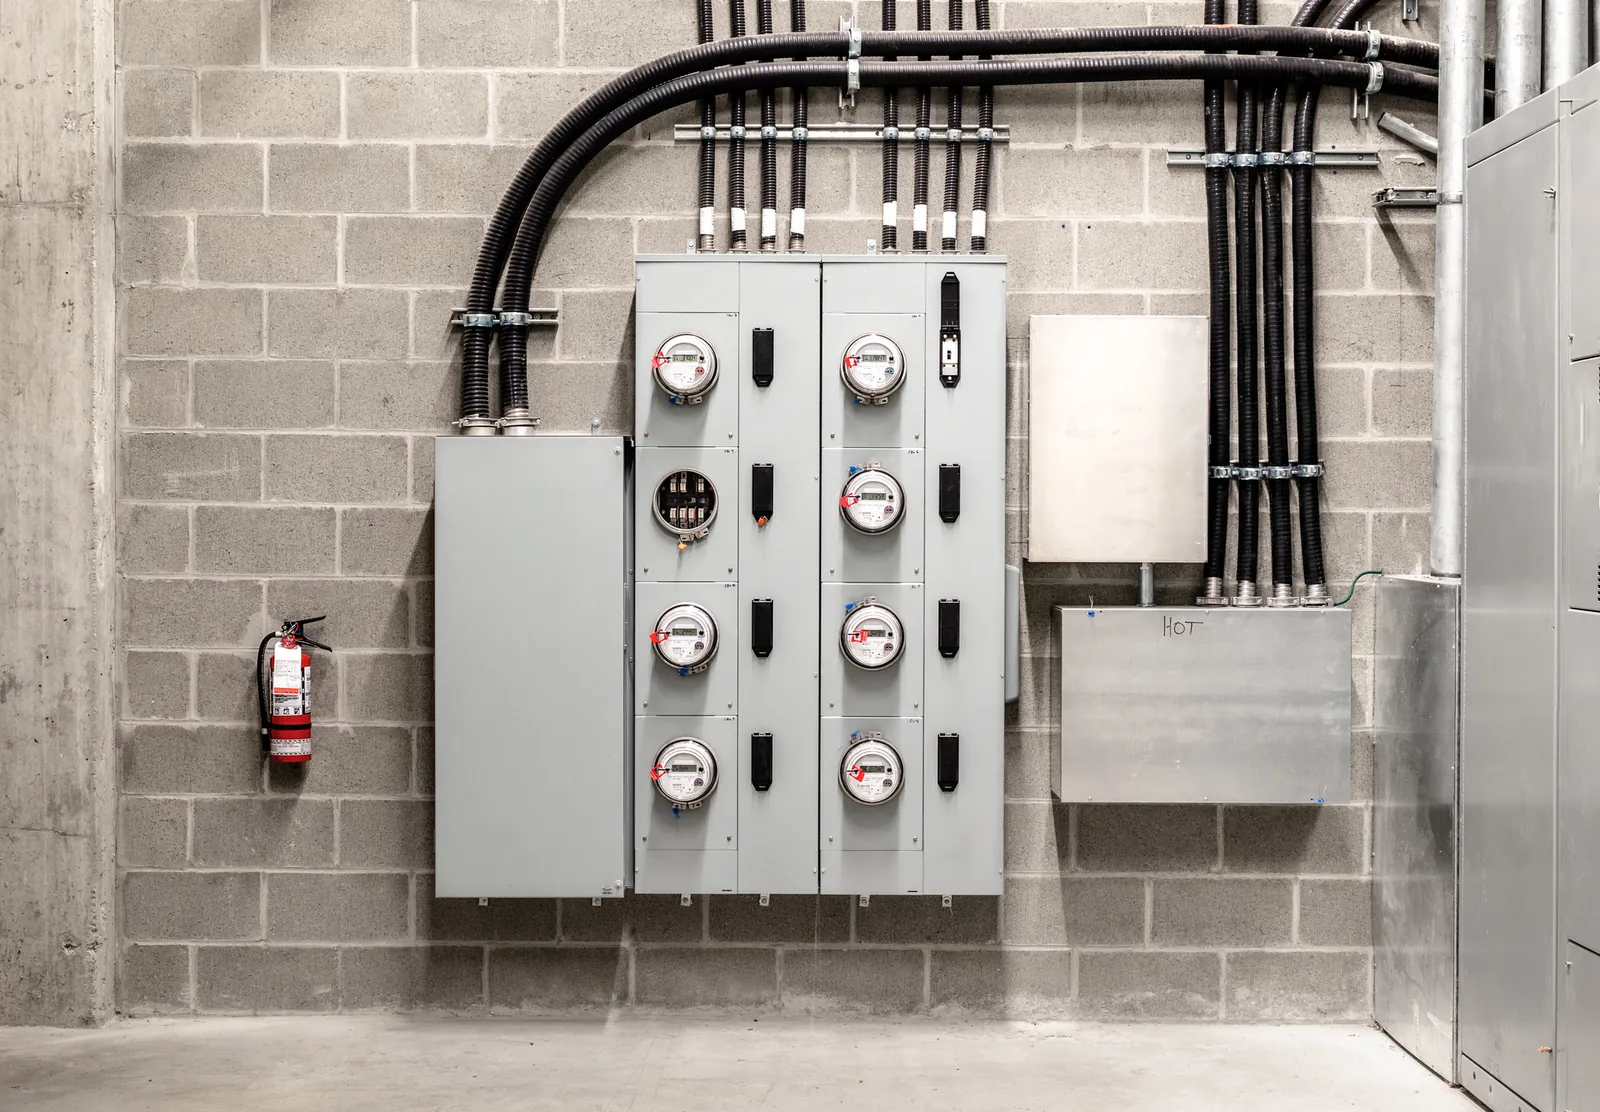
An energy management system (EMS) is the combination of meters, software, and controls that a building owner uses to measure, analyze, and reduce energy use and cost. In commercial buildings, an EMS collects utility and meter data, normalizes it for weather and occupancy, benchmarks performance, flags waste, and often adjusts equipment through the building automation system.
Utility spend is one of the few large operating expenses that a building's own engineering team can reduce without a lease negotiation or a capital program. An energy management system supplies the measurements behind that work: consumption by building, by meter, and by hour, set against the weather, the occupancy, and the tariff each building pays. Without those measurements, waste in a well-run building stays largely invisible, because the HVAC system keeps spaces comfortable while running longer and harder than the load requires.
Which systems are called energy management systems?
The name covers several distinct kinds of system, and vendor materials, standards documents, and search results mix them freely.
| Meaning | Description | Typical users |
|---|---|---|
| Building energy management system (BEMS or EMS) | Meters, software, and controls that measure and reduce energy use in a building or portfolio | Building owners, facilities teams, energy managers |
| ISO 50001 energy management system (EnMS) | An organizational system of policies, objectives, roles, and reviews for continual improvement in energy performance | Industrial sites, campuses, and public agencies, often pursuing certification |
| Grid energy management system | Software that transmission and distribution operators use to monitor the network and dispatch generation in real time | Utilities and grid operators |
| Site or battery energy management system | A controller that coordinates on-site batteries, solar generation, and EV charging against tariffs and grid signals | Owners of distributed energy resources and their installers |
Commercial building owners and operators almost always mean the first, usually shortened to EMS.
The ISO 50001 meaning overlaps most with the building meaning. The US Department of Energy describes an energy management system in the ISO sense as "a set of practices that create a culture of continual improvement in energy performance". ISO 50001, first published in 2011 and revised in 2018, sets requirements for an organization's energy policy, energy review, baselines, performance indicators, and management review. The standard is technology-neutral. Software supplies much of the measurement an ISO 50001 program requires, but conformance depends on the management processes around the data. On the same page, written for manufacturers, the Department of Energy reports that industrial sites taking part in its energy management programs typically achieve energy savings of 4 percent a year for more than a decade.
How does a building energy management system relate to a BMS?
A building management system controls equipment, and an energy management system measures and manages the energy that equipment consumes. The BMS acts within seconds on sensor readings, holding each zone and system at its setpoint. The EMS works across hours, months, and years, using meter data, utility bills, and weather to judge whether a building is using more energy than its operation requires.
| Building management system | Energy management system | |
|---|---|---|
| Primary job | Run equipment to schedules, setpoints, and sequences of operation | Measure, analyze, and reduce energy use and cost |
| Main data | Sensor readings, equipment status, and control points | Utility bills, interval meter data, submeters, and weather |
| Time scale | Seconds to minutes | Hours to years |
| Typical users | Building engineers and technicians | Energy managers, sustainability teams, asset managers, and engineers |
| Effect on equipment | Continuous, through control loops | Occasional, through the BMS or an automated demand function |
The two systems overlap in practice. Many BMS platforms include metering and energy dashboards, a configuration often sold as a building energy management system. Many energy management systems read BMS trend data, because equipment data explains changes that a meter can only record. The building management systems guide covers the control side in detail.
How does an energy management system work?
An energy management system collects energy data, normalizes it so that periods and buildings can be compared, analyzes it for waste, and turns the findings into reports, alerts, or control actions.
Collection: Utility bills and interval data arrive from each utility account, through a data provider or the utility's own download service. Submeter readings and BMS points arrive through gateways installed on site. Weather data comes from a nearby station or a commercial weather service.
Normalization: The system converts every fuel into common units, applies each building's tariff to calculate cost, and adjusts for weather using heating and cooling degree days, so that a mild January can be compared fairly with a cold one. Adjusting for floor area and operating hours lets a portfolio compare buildings of different sizes and uses.
Analysis: Benchmarking compares each building against its own history, against peers in the portfolio, and against national data such as the 1 to 100 score in ENERGY STAR Portfolio Manager. A baseline model predicts expected consumption from weather and schedule, and a widening gap between expected and actual consumption signals drift. Interval data adds the load profile: overnight base load, morning start-up spikes, and the afternoon peaks that set demand charges.
Action: Findings leave the system as reports for owners and regulators, alerts for operators, or commands to equipment. Some systems send setpoint and schedule changes to the BMS or shed load automatically during peaks. Most pass their findings to engineers, who decide what to change and make the change through the building's controls.
Which data does an energy management system use?
The precision of an energy management system follows its finest data source. Monthly bills show that consumption changed, interval data shows when, and equipment data shows why.
| Data source | Typical resolution | Shows |
|---|---|---|
| Utility bills | Monthly | Consumption, cost, demand charges, and tariff, by account |
| Utility interval data | Commonly 15 minutes or hourly | Daily load shape, overnight base load, and the timing of peaks |
| Submeters | Seconds to 15 minutes | Consumption by tenant, floor, or system, such as a chiller plant or a data room |
| BMS trend data | Seconds to 15 minutes | Equipment status, setpoints, and conditions that explain changes in consumption |
| Weather data | Hourly or daily | Outdoor temperature and humidity for normalization |
A building that runs its air handlers through the night illustrates the difference. The monthly bill shows a higher total. Interval data shows overnight base load rising from a particular date. BMS trend data shows the fan schedule that changed on that date, and names the air handler.
In the United States, many utilities let customers download usage data in the format defined by Green Button, an industry standard for energy usage information. Collecting bills and interval data across hundreds of accounts and utilities remains one of the larger tasks in deploying an energy management system, which is why many products rely on specialist utility data providers.
Energy management and information systems (EMIS)
The US Department of Energy groups the software in this market under the name energy management and information systems (EMIS), a family running from bill tracking to software that adjusts equipment. The DOE lists benchmarking and utility tracking tools, energy information systems, equipment-specific fault detection and diagnostic systems, automated system optimization, and building automation systems.
| Category | Function | Main data |
|---|---|---|
| Benchmarking and utility tracking | Tracks bills, flags billing errors, and compares buildings | Monthly utility bills |
| Energy information system (EIS) | Analyzes meter data to find anomalies, track savings, and report | Interval and submeter data, weather |
| Fault detection and diagnostics (FDD) | Identifies equipment operating incorrectly and attributes a probable cause | BMS trend data |
| Automated system optimization (ASO) | Writes setpoints and schedules to the BMS to optimize operation continuously | BMS trend data and writable control points |
| Building automation system (BAS) | Controls equipment in real time | Sensor readings and equipment status |
Products sold as energy management systems frequently span the first two categories, and many now add fault detection. The categories matter because each answers a different question. An EIS might report that a building used 12 percent more electricity than its weather-adjusted baseline in March. FDD software might report that an air handler's outdoor air damper has been stuck open since February. The fault detection and diagnostics guide covers that second kind of analysis.
How much can an energy management system save?
The Department of Energy's largest field study of energy analytics found median savings of 4 percent for energy information systems and 9 percent for fault detection software, with simple payback of one to two years.
That study, the Smart Energy Analytics Campaign, ran from 2016 with Lawrence Berkeley National Laboratory as technical lead. By late 2019 it covered 96 commercial organizations, nearly 6,000 buildings, and 518 million square feet. The savings figures are whole-building results measured after two years, and DOE notes that the savings "cannot be attributed solely to the operational improvements achieved with the support of the EMIS," since participants ran other projects at the same time.
Costs were modest by comparison. A 2019 synthesis of campaign data by Lawrence Berkeley National Laboratory found the following median costs:
- Base cost: About $0.01 per square foot for energy information systems and $0.05 per square foot for fault detection software
- Annual software fees: About $0.01 per square foot for energy information systems and $0.02 for fault detection software
- In-house labor: About $0.03 per square foot per year across all EMIS
Staff time therefore matched or exceeded software spend. In practice, this means that the engineering hours available to investigate findings frequently decide what an energy management system returns: the software identifies the waste, and an engineer still has to diagnose the cause, settle on a fix, and make the change.
Why do energy management systems fall short?
Energy management systems most often fall short at the step between finding waste and correcting its cause. The common failure points are the following:
- Findings without capacity: An EMS can flag anomalies across a portfolio faster than a small engineering team can investigate them, and findings left unreviewed save nothing.
- Data too coarse to diagnose: Monthly bills and whole-building meters show that consumption rose without identifying the equipment responsible.
- Gaps in metering: Accounts without interval data, and tenant spaces without submeters, leave the system estimating where precision matters most.
- Contested savings: Reported savings without an agreed baseline and method invite challenge from finance teams, auditors, and lenders.
Retro-commissioning attacks the same gap from the other direction, sending engineers into the building to find and correct operating problems on a fixed cycle.
How does an energy management system verify savings?
An energy management system verifies savings by comparing measured consumption after a change with a baseline model of the consumption the building would have recorded without the change, adjusted for weather, occupancy, and other conditions.
The International Performance Measurement and Verification Protocol (IPMVP), published by the Efficiency Valuation Organization, defines four options:
| IPMVP option | Method | Suited to |
|---|---|---|
| A: Retrofit isolation, key parameter measurement | Measures the main parameter of one measure and estimates the rest | Lighting retrofits and constant-load equipment |
| B: Retrofit isolation, all parameter measurement | Measures all energy use of the affected system | Variable-speed drives, chiller replacements, system-level control changes |
| C: Whole facility | Compares utility or main-meter consumption before and after | Multiple measures, operational changes, and whole-building programs |
| D: Calibrated simulation | Uses a calibrated energy model in place of a measured baseline | New construction and cases without baseline data |
ASHRAE Guideline 14, Measurement of Energy, Demand, and Water Savings, sets the statistical tests a baseline model must pass before its predictions can stand as evidence.
Option C fits energy management systems naturally, because it relies on meter data the system already collects. Whole-facility measurement works best when savings are large relative to normal variation in a building's consumption. Smaller measures, such as a single schedule change on one air handler, frequently need Option A or B, or equipment-level data, to show up clearly.
How does an energy management system reduce peak demand?
Commercial electricity tariffs frequently bill demand, the highest rate of consumption in a billing period measured in kilowatts, as a separate charge from energy measured in kilowatt-hours, and an energy management system with interval data shows when those peaks occur and which loads drive each peak. On many tariffs the single highest 15-minute interval of the month sets the demand charge, and some tariffs carry part of that charge forward into later months.
Building teams lower peaks through the following operational measures:
- Staggered start-up: Bringing air handlers and chillers online in sequence, which avoids a morning spike
- Pre-cooling: Cooling the building before the afternoon peak and letting temperatures drift upward within comfort limits during it
- Temporary setpoint changes: Raising occupied cooling setpoints by a few degrees for the length of a peak
- Load shifting: Moving flexible loads, such as ice storage charging or EV charging, to off-peak hours
Utility demand response programs pay customers to reduce demand during grid events, and some energy management systems shed or shift load automatically when demand approaches a set limit. What is Peak Load? explains the underlying tariff mechanics.
How does an energy management system support compliance?
Benchmarking laws require owners to report energy use, building performance standards increasingly cap energy use or emissions, and an energy management system supplies the consumption data and the year-round tracking that both kinds of law require.
Many US benchmarking laws require reporting through ENERGY STAR Portfolio Manager, and Portfolio Manager's web services allow approved software to sync meter readings with no manual uploads. Building performance standards, such as New York City's Local Law 97 and Boston's BERDO, set limits that a building has to meet each year, which turns an annual reporting exercise into a forecasting problem. An energy management system shows mid-year whether a building is on track, and which systems account for any shortfall. The building energy regulations guide covers the laws in force by jurisdiction.
How should a team evaluate an energy management system?
The following criteria separate systems that report energy from systems that help reduce consumption.
Data coverage: Automatic collection of bills and interval data across every utility and account in the portfolio, plus support for submeters and BMS data.
Normalization: Weather normalization, tariff modeling, and adjustment for floor area and operating schedules.
Diagnosis: The ability to trace a change in consumption to specific equipment, which requires BMS data and usually fault detection.
Action path: A defined route from finding to fix, whether through work orders, engineer review, or authorized commands to the BMS.
Verification: A documented M&V method aligned with IPMVP or ASHRAE Guideline 14.
Reporting: Automatic exchange with ENERGY STAR Portfolio Manager and the disclosure frameworks that apply to the portfolio, such as GRESB.
Security: Outbound-only connections from site gateways, and documented certifications such as ISO 27001 or SOC 2.
How to Choose Energy Management Software for Your Portfolio in the Age of AI covers the questions to put to vendors in a demo.
Where Noda fits
Noda is an agentic AI platform for commercial building operations that works as an always-on virtual building engineer, scaling engineering team capacity across every asset in a portfolio.
Traditional energy management tools typically run on utility bills and building-level meter data. They report that consumption spiked, and often when, but rarely which equipment caused the spike or what change would correct it. This means that engineers still investigate each finding by hand before anything changes.
Noda reads each building's equipment data alongside its meters and treats every fault and anomaly as an input to investigate. Noda's AI agents take on most of the analysis that engineering teams used to do manually: tracing waste to its root cause, working out the change that corrects it, and estimating the savings. Engineers receive Projects, specific changes to setpoints, schedules, and control sequences, with the evidence attached and ready to accept. For demand peaks, Noda's Automated Demand Management sheds or shifts HVAC load automatically, with no operator needed during the event.
Related reading
- Building Management Systems (BMS) and Building Automation Systems (BAS): A Complete Guide
- ENERGY STAR Portfolio Manager: A Complete Guide
- Fault Detection and Diagnostics: A Complete Guide
- Building Energy Regulations: A Global Guide
- How to Choose Energy Management Software for Your Portfolio in the Age of AI
- Why Fragmented Building and Energy Data is Costing You Millions
Frequently asked questions
Is an energy management system the same as a building management system?
No. A building management system (BMS) runs equipment in real time to schedules, setpoints, and sequences of operation. An energy management system (EMS) measures and analyzes energy use and cost, mostly from utility and meter data, to find waste and track savings. Many BMS platforms include energy dashboards and many EMS products read BMS data, so the two frequently work as a pair.
How is a building energy management system (BEMS) different from an EMS?
The two terms overlap heavily. BEMS usually describes a building management system configured with metering, energy reporting, and energy-focused control strategies. EMS more often describes software that analyzes utility and meter data across a building or a portfolio. Vendors apply both names to similar products.
Is an energy management system the same as ISO 50001?
ISO 50001 describes an energy management system in organizational terms: an energy policy, an energy review, baselines, performance indicators, and regular management review aimed at continual improvement. EMS software supplies the measurement and reporting that an ISO 50001 program requires. The standard is technology-neutral, and certification rests on the management processes, so software alone cannot make an organization conform.
Which data does an energy management system need?
At minimum, utility bills for every account a building pays. Most systems add interval data from utility smart meters, submeter readings for tenants or major systems, weather data for normalization, and in many cases trend data from the building automation system, which explains why consumption changed.
How often should energy data be collected?
Monthly bills are enough for benchmarking and annual reporting. Diagnosing waste and managing peak demand requires interval data, commonly at 15-minute resolution. Tracing a change in consumption to a specific piece of equipment requires BMS trend data or submeter readings at similar or finer resolution.
Does an energy management system need new meters?
Not always. Many systems start from utility bills and the interval data that utility smart meters already record. Owners add submeters where they need consumption by tenant, floor, or system, or where the utility provides no interval data for an account.
Can an energy management system control equipment?
Some can. Systems integrated with the building automation system can send setpoint and schedule changes, or shed load during demand peaks, where the owner authorizes write access. Many others are read-only and pass their findings to engineers, who make any changes through the BMS.
How much energy can an energy management system save?
In the US Department of Energy's Smart Energy Analytics Campaign, which covered nearly 6,000 buildings, median whole-building savings after two years were 4 percent for organizations using energy information systems and 9 percent for organizations using fault detection and diagnostics. DOE cautions that other projects running in the same buildings contributed to those results.
How much does an energy management system cost?
Cost depends on portfolio size, metering, and software scope. A 2019 Lawrence Berkeley National Laboratory synthesis of Smart Energy Analytics Campaign data found median base costs of about $0.01 per square foot for energy information systems and $0.05 per square foot for fault detection software, plus median annual software fees of $0.01 to $0.02 per square foot. Staff time to act on findings added a comparable annual cost.
How long does an energy management system take to pay back?
The Department of Energy reported simple payback of one to two years for energy information systems and fault detection software in its Smart Energy Analytics Campaign. Payback depends on whether the building team acts on the findings, since the software saves energy only through the operational changes it prompts.
Is an energy management system the same as an energy information system?
An energy information system (EIS) is one category of energy management software: tools that analyze interval meter data to track consumption, flag anomalies, and report savings. The Department of Energy groups EIS with benchmarking tools, fault detection and diagnostics, automated system optimization, and building automation under the name energy management and information systems (EMIS).
How does weather normalization work?
Weather normalization adjusts consumption for differences in outdoor conditions so that two periods can be compared fairly. A baseline model relates past consumption to heating and cooling degree days or to hourly temperature, and the system compares actual consumption with the model's prediction for the weather that occurred.
How are energy savings verified?
Verification compares measured consumption after a change with a baseline adjusted for weather, occupancy, and other conditions. The International Performance Measurement and Verification Protocol (IPMVP) defines four options, from isolating a single measure to modeling the whole facility, and ASHRAE Guideline 14 sets statistical requirements for the baseline models.
How does an energy management system help with demand charges?
Interval data shows when each month's demand peak occurs and which loads coincide with the peak. Building teams use that information to stagger equipment start-up, pre-cool spaces, or raise cooling setpoints temporarily, and some energy management systems shed or shift load automatically as demand approaches a set limit.
Does an energy management system help with Local Law 97 and other building performance standards?
Yes. Building performance standards cap energy use or emissions, and an energy management system tracks a building against its cap through the year, identifies the systems driving any shortfall, and supplies the consumption data for annual reports. Many US benchmarking laws also require reporting through ENERGY STAR Portfolio Manager.
Does an energy management system connect to ENERGY STAR Portfolio Manager?
Many do. Portfolio Manager offers web services that let approved software exchange meter data and property details automatically, which removes manual uploads from benchmarking, compliance reporting, and ENERGY STAR certification.